Jeremy Saaj — Business Analyst

Hello there! I translate messy, complex data into clean logic that business leaders can actually act on.

Great to have you here. Let's take a look around at some of my favorite projects.

My Work

Project 04
01 / 08
Automating B2B Artist Branding via AI-Driven Metadata Synthesis
Engineered <90s EPK automation solving artist cold-start.
Cut AI hallucinations 80% via deterministic prompt engineering.
Delivered 100% UAT on $0 technology stack budget.
INDIE-GO
Techniques
MoSCoW Prioritization & Scope Management SWOT Analysis WAGILE Methodology Execution Requirements Traceability & Mapping (RTM) UAT Coordination RACI Governance
Year
2026
Role
App Owner/Developer
Tools & Technologies
Python 3.10+ & Streamlit Spotify Web API (OAuth 2.0) fpdf2 Web Scraping
Project 02
02 / 08
Holistic Education and Wellness Engineering
Built 3-level AI flashcard breakdown system.
Developed quizzes for adaptive lesson recommendations.
Architected student tracking with gap mapping.
MindMate AI
Techniques
User Journey Mapping Functional Requirement Specification AI Interaction Design Analytics Design Gamification Strategy
Year
2026
Role
App owner/Developer
Tools & Technologies
Google Gemini API React 19 & TypeScript Tailwind CSS Three.js Node.js & Express
Project 03
03 / 08
Scaling a digital-first beauty brand from user-led discovery to BI insights
Secured $800K via Minto-aligned business case.
Bridged 87% loyalty gap via VIP migration.
Unified 15+ silos, ending trend-lag and stockouts.
MASQUE
Year
2026
Role
Lead Business Analyst
Tools & Technologies
Power BI Miro
Project 01
04 / 08
Europe Pandemic Resilience: Data-Driven Health Strategy
Linked health access to 20% deaths, guiding funding.
Shifted budget from buildings to specialized surge training.
Unified nations for an 18-month resilience baseline.
DG SANTE
Techniques
Data Quality Assessment & Cleaning Statistical Correlation Analysis Interactive Dashboard Engineering Trend & Time-Series Analysis Gap Analysis & Prescriptive Modeling
Year
2025
Role
Data Analyst
My Stacks
Power BI Excel
Project 02
05 / 08
AFL Forward Recruitment & Performance Analysis
Targeted 189–192cm "sweet spot" for elite scoring.
Mapped dual age peaks to optimize roster stability.
Unified 10-year stats into an interactive scouting engine.
AFL
Techniques
Data Integration Correlation Analysis Interactive Engineering Performance Mapping
Year
2025
Role
Analyst Consultant
Tools & Technologies
Tableau
Project 06
06 / 08
Consolidating fragmented match-day journeys into a unified AI-driven fan concierge
Targeting 85% containment for match-day logistics.
Zero hallucinations through strict embedded data.
Unified four platforms into one touchpoint.
AFL
Techniques
7-Playbook Conversational Architecture Design Targeted Fan Persona & Story Mapping Hybrid Prompt Engineering & Data Grounding KPI Development & Success Matrix Tracking Iterative Prototype QA & Failure Testing
Year
2026
Role
AI Solution Architect
Tools & Technologies
Google Vertex AI
Project 07
07 / 08
Data-Driven Crop Yield Optimization
Built 92.1% accurate crop yield model.
Identified 5.3 t/ha regional yield gap.
Reduced yield prediction error by 30%.
AgriFuture Solutions
Techniques
Descriptive Statistical Analysis Data Binarization & Transformation Iterative Regression Modeling Outlier Treatment via Residual Analysis Regional Benchmarking & Gap Analysis Prescriptive Modeling for Resource Allocation
Year
2025
Role
Lead Business Analyst
Tools & Technologies
Microsoft Excel
Project 08
08 / 08
Victorian Road Safety Strategic Analysis
Median imputation preserved 100% of dataset integrity.
Pinpointed 60 km/h zones as frequency hotspots.
Straight roads carry double the fatality risk.
Engineered a strategic four-pillar road safety plan.
VicRoads
Techniques
Data Wrangling & Median Imputation Geospatial & LGA Hotspot Mapping Demographic Interaction Profiling Strategic Policy Modeling
Year
2025
Role
Data Analyst
Tools & Technologies
R Programming

Hello! I am Jeremy, a business analyst with a passion for uncovering the human stories hidden behind complex digital chaos.

Jeremy

I specialize in translating complex data into clear logic and actionable insights, empowering stakeholders to make better business decisions. My focus is on evidence-based solutions and measurable impact.

Clear Connected Grounded Impactful

These are my core analytical values, and I strive to imbue them in all of the work I do. I've always been drawn to the idea of data being told as a story, something that everyone can look at and easily understand. Simplifying things that have been made unnecessarily complex is a practice I love and resides in my core. Collaborating with different teams to help them understand each other and work as a single unit gives me energy. I like thinking big, working fast, yet carefully, holistically, looking at the overarching business problem, and zooming in on the data details. I'm always improving, growing, and executing to the highest standard possible. All while achieving a larger mission, making sure that technical tools serve the people using them, and ensuring organisations waste no time or money on the wrong solutions.

I got my start in data analysis through an internship where I realised I had a natural flair for translating technical details into clear logic. Over time, I evolved to focus on business analytics, specialising in requirements engineering, core programming, and generative AI frameworks. Leveraging my analytical foundation and deep stakeholder empathy, I've established myself as a well-rounded business analyst professional who ensures projects deliver true value at every step: from mapping workflows and building business cases, to structuring predictive models and automated data pipelines. My insatiable curiosity, practical approach, and adaptability enable me to give stakeholders total confidence in their decisions within our ever-changing digital environment.

La Trobe University
Master of Business Analytics
2025 — PresentMelbourne
I am advancing my expertise in predictive modeling, requirements engineering, and generative AI frameworks, applying these methodologies to structured research papers and data-driven simulation projects.
UST
Production Systems Engineer
2024 — 2025Kerala, India
I monitored cloud-based production systems for an enterprise client, analyzing system logs and message flows to resolve backend service failures and keep core business operations running reliably.
iDatalytics
Data Analyst Intern
2024Kerala, India
I preprocessed and cleaned messy business datasets to eliminate inconsistencies, then built the core dashboards and visual trends the team relied on to guide their daily work.
Rajagiri School of Engineering & Technology
Bachelor of Engineering Technology in IT
2019 — 2023Kerala, India
I developed my technical foundation in core programming, software logic, and information systems, learning how technology infrastructure supports broader functional needs.

Publications & Contributions

2026
OpenClaw-Driven Dynamic Agent Orchestration for Deep-Tier Supply Chain Disruption Intelligence Ongoing
Conference / Journal · Location
This paper introduces an automated multi-agent AI system that detects deep-tier supply chain disruptions by turning raw news headlines into structured risk reports. It uses graph databases and a mathematical formula to trace supplier networks down to Tier-4, providing companies with an early warning system for operational failures.
2026
Member · Google Developer Groups (GDG) Melbourne
Google Developer Groups · Melbourne, Australia
Active member of GDG Melbourne, engaging with the local developer and technology community through events, workshops, and knowledge-sharing sessions.

My Stack

Commitment to staying updated with the latest analytics trends and techniques.

Databricks Platforms & Enterprise BI
Power BI Platforms & Enterprise BI
Tableau Platforms & Enterprise BI
Excel Platforms & Enterprise BI
Tibco Platforms & Enterprise BI
🔬
SAS Viya Platforms & Enterprise BI
Python Generative AI & Data Science
R Generative AI & Data Science
📈
SAS Enterprise Generative AI & Data Science
SQL Generative AI & Data Science
Google Vertex AI Generative AI & Data Science
Dialogflow Generative AI & Data Science
📝
Prompt Engineering Generative AI & Data Science
🏗️
Conversational AI Architecture Generative AI & Data Science
🔮
Predictive Analytics Generative AI & Data Science
Jira Project & Workflow Agility
ServiceNow Project & Workflow Agility
Miro Project & Workflow Agility
🔄
Agile Project & Workflow Agility
🏉
Scrum Project & Workflow Agility
📌
Kanban Project & Workflow Agility
💧
Waterfall Project & Workflow Agility
🔀
WAGILE Project & Workflow Agility
💼
Business Case Development Strategy, Logic & Governance
💰
Benefit Realisation Strategy, Logic & Governance
📊
KPI & Success Matrix Design Strategy, Logic & Governance
🔺
Minto Pyramid Logic Strategy, Logic & Governance
🛡️
AI Governance & NIST Framework Strategy, Logic & Governance

Got an opportunity?
Let's talk.

Always down to collaborate on interesting data projects or talk strategy. Drop me a line if you want to build something clear out of the chaos.

AFL

AFL Forward Recruitment & Performance Analysis

AFL Scouting Opening
My Role
Analyst Consultant Data Engineering, Statistical Correlation, Visual Analytics Engineering
Deliverables
  • Interactive Tableau Scouting Engine: Centralized recruitment dashboard
  • AFL Player Performance Report: Technical analysis of physical and age-based trends
  • Strategic Recruitment Presentation: Data-backed board recommendations
Team
AFL Team Manager Board of Directors Recruitment & Draft Leads
Year
2025

What was the problem?

The AFL team manager lacked an objective, data-backed method for scouting elite forward talent. Recruitment decisions relied on subjective reputation rather than measurable efficiency. Without visibility into how physical traits like height and weight correlated with scoring, or identifying when a player reached their statistical peak, the club faced significant risk in draft picks and long-term contract negotiations.


The Roadblocks

Data Fragmentation: Player physical traits and match performance statistics were trapped in separate files, preventing integrated scouting analysis.
Scouting Bias: No empirical evidence existed to define the "ideal" physical forward profile, leading to inconsistent recruitment.
Contract Lifecycle Risks: There was no visibility into performance decline thresholds, risking expensive deals for players past their prime.

Discovery: Requirements Engineering

I unified 10 years of match statistics (2012–2021) with player physical data by joining the datasets on a unique playerId. I engineered calculated fields to transform raw birth dates into active age segments (e.g., "Rising," "Peak," "Veteran"), allowing for precise time-series analysis of player career lifecycles.


Insights: The Interactive Scouting Engine

I developed a comprehensive Tableau dashboard to provide the manager with a "single source of truth" for recruitment.

AFL Scouting Dashboard

The complete AFL scouting dashboard — one integrated view from talent identification to performance stability.

Elite Talent Identification (Top Left): Utilizing Bertin's law of length, I ranked the top 10 forwards by average goals. Orange conditional highlighting instantly identifies the top 5 elite targets for priority scouting.
Physical Profile Optimization (Centre Top): These visualizations pinpointed a recruitment "sweet spot" between 189cm and 192cm, where scoring efficiency peaks.
Recruitment Windows (Bottom Left): The age progression chart identified dual performance peaks at ages 20–22 and 25–27, providing a roadmap for youth investment and prime-age acquisitions.
Performance Stability (Bottom Right): This triple line chart tracks goals, assists, and marks over seasons, identifying performance decline — typically after age 35 — to mitigate long-term contract risks.

Pitch and Impact

The analysis transitioned the club to prescriptive recruitment. By unifying a decade of data into one interactive engine, I provided the manager with the ability to drill down from league-wide trends to individual player deep-dives. This strategy optimizes roster ROI by focusing draft capital on high-probability physical profiles and aligning contracts with data-backed performance windows.


Key Metrics

189–192cm
Optimal height range identified for high-probability scoring
25–27
Prime career window identified for maximum roster investment
10 Years
Historical data (2012–2021) unified to eliminate scouting bias
Age 35+
Statistical decline threshold used for contract risk mitigation

I transformed raw match data into a high-impact scouting engine. By bridging physical traits and game output, I anchored the club's recruitment in objective value, ensuring higher goals per season and long-term squad stability.


Connect with me

Interested in working together or want to know more about this project? Reach out.

Email Jeremy Saaj JeremySaaj Instagram
DG SANTE

Europe Pandemic Resilience: Data-Driven Health Strategy

Europe Pandemic Resilience opening
My Role
Data Analyst DG SANTE
Techniques
  • Data Quality Assessment & Cleaning
  • Statistical Correlation Analysis
  • Interactive Dashboard Engineering
  • Trend & Time-Series Analysis
  • Gap Analysis & Prescriptive Modeling
Deliverables
  • Excel Strategic Dashboard: Geographic Vulnerability Mapping
  • Power BI Resilience Suite: Impact & Recovery Analysis
  • Evidence-Based Budget Roadmap: Specialized Training vs. Infrastructure
Team
DG SANTE Leadership Regional Health Authorities Data Engineering Team Policy Advisors
Year
2025

What was the problem?

The European Commission (DG SANTE) lacked evidence-based metrics to guide next year's pandemic budget. Without clear data, the Commission could not identify which countries faced the highest risk with the most limited response capacity. An actionable plan was required to ensure 748 million citizens remain safe through targeted resilience spending.


The Roadblocks

Data "Blind Spots"

Critical datasets contained numerous null values and zeros for smaller nations like Andorra and Monaco, creating reporting gaps that could lead to incorrect business decisions.

Confusing Performance Outliers

Initial analysis showed "Recovery Mysteries," where countries like Finland possessed decent hospital capacity but surprisingly low recovery rates, suggesting that infrastructure alone was not the solution.

Discovery: Requirements Engineering

I used Excel to map the general healthcare gaps across the continent, identifying "hot zones" where the virus spread most easily. This visual mapping provided the "quick glance" metrics needed for leadership to understand regional vulnerability.

Excel Dashboard

Figure 1: Excel Dashboard – High-level trends and geographic case strength analysis.


Insights: BI Prototyping

I engineered a two-page Power BI suite to provide deep-dive interactivity, allowing leadership to drill down from yearly trends to monthly regional specifics.

Impact Analysis Dashboard

This tool correlated healthcare access with mortality, revealing that the 10 nations with the lowest access accounted for over 20% of total deaths.

Power BI Impact Analysis

Figure 2: Power BI Impact Analysis – Correlating healthcare access with regional mortality rates.

Recovery & Resilience Dashboard

Focusing on "active cases," this dashboard identified where healthcare systems were at risk of burnout and where vaccination rates failed to improve recovery outcomes.

Power BI Recovery Analysis

Figure 3: Power BI Recovery Analysis – Matrix reporting on hospital capacity and vaccination uptake.


Pitch and Impact

The analysis successfully pivoted the DG SANTE strategy from general infrastructure spending to specialized surge training and emergency capacity. By identifying the inverse relationship between access and survival, I provided a roadmap that moves away from guesswork toward evidence-based life-saving decisions.


Key Metrics

1.85%
Overall regional mortality rate established as a resilience baseline
20%+
Total European deaths linked to the 10 most vulnerable nations
47M
Successful recoveries tracked to identify effective treatment patterns
44+
Nations unified into a single source of truth for budget allocation

I transformed fragmented pandemic data into a development-ready budget strategy. By bridging the gap between raw statistics and policy recommendations, I anchored the Commission's health spending in measurable business value.


Connect with me

Interested in working together or want to know more about this project? Reach out.

Email Jeremy Saaj JeremySaaj Instagram
MASQUE

Scaling a digital-first beauty brand from user-led discovery to BI insights

Project 03 Opening Image
My Role
Lead Business Analyst Strategy, Requirements Discovery, Data Prototyping
Deliverables
  • Minto Strategic Business Case: $800,000 Investment Justification
  • Miro Strategic War Room: 10 Personas and 20 User Stories
  • Strategic and Operational Power BI Dashboards
  • Strategic Project Presentation: YouTube
Team
CEO Chief Data Officer Chief Marketing Officer Product Lead Data Engineers
Year
2025

What was the problem?

MASQUE experienced rapid growth through viral social media campaigns. This expansion caused significant trend lag and frequent stockouts. Management relied on creative intuition rather than real time data. An $800,000 investment was required to centralize analytics and support international scaling.


The Roadblocks

Data Fragmentation

Fifteen disconnected data silos hindered growth.
The CMO lacked clear influencer ROI metrics.
Logistics teams struggled with unpredicted demand spikes during viral surges.
Fragmented spreadsheets slowed down regulatory audits and safety compliance.

Discovery: Requirements Engineering

I used Miro to map stakeholder needs directly to technical tasks. This visual roadmap bridged silos across the company to ensure the analytic stack served every department.

Internal Leadership Miro Frame

Defining high level goals for the CEO, CDO, and CMO to align the platform with strategic growth.

Operational and External Team Miro Frame

Mapping requirements for influencers, investors, and product leads to manage market trends and verify ROI.

Miro 3 - Strategy & Compliance

Finalizing requirements for logistics, beauty therapists, and regulators to ensure supply chain stability.

Each of the 20 user stories utilized Given, When, Then acceptance criteria. This strict checklist removed technical ambiguity for the development phase.


Insights: BI Prototyping

I built a Power BI prototype to visualize raw datasets and validate user stories. This brought the abstract requirements to life for the management team.

Strategy Performance Dashboard

Strategic overview identifying a critical 87.3% revenue drop-off in loyalty tiers, informing a new VIP migration strategy.

Marketing and Customer Analytics Dashboard

Tracking influencer ROI and website traffic volume by region and age group.

Operational Analysis Dashboard

SKU level performance monitoring and stock level alerts to resolve inventory instability.

Innovation and Compliance Dashboard

Monitoring supply chain eco-efficiency and raw material stock levels for international expansion.


Pitch and Impact

The analysis pitch transitioned MASQUE to data-backed decision-making. I unified 15 silos into a visual prototype to prove the concept's value. This presentation established a single source of truth for the leadership team.

Watch the Full Strategic Presentation (10 min)

Key Metrics

87.3%
Revenue drop-off identified between Bronze and Platinum loyalty tiers
$800K
Strategic budget justified through Minto-aligned logic
15+
Data silos unified into one prototype repository
80%
Confidence achieved in predictive demand forecasting models

I transformed creative vision into a development-ready backlog. By bridging stakeholders and engineering, I anchored the $800,000 investment in business value. Data-backed logic now guides MASQUE's global expansion and customer loyalty strategies.


Connect with me

Interested in working together or want to know more about this project? Reach out.

jeremysaaj4@gmail.com Jeremy Saaj JeremySaaj
INDIE-GO

Indie-Go: AI-Powered EPK Generator for Spotify

Indie-Go opening
My Role
App owner/developer Strategy, Requirements Discovery, Hybrid WAGILE Delivery
Techniques
  • MoSCoW Prioritization & Scope Management
  • SWOT Analysis
  • WAGILE Methodology Execution
  • Requirements Traceability & Mapping (RTM)
  • UAT Coordination
  • RACI Governance
Deliverables
  • Functional Web Application: Reactive Streamlit-based control panel.
  • Requirements Traceability Matrix (RTM): 13 mapped functional and quality requirements.
  • Programmatic PDF Export Engine: Automated A4 rendering in three distinct styles.
  • Strategic SWOT Analysis: B2B market justification for Spotify-native branding.
Team
Project Manager — Jeremy Saaj Senior Business Analyst — Rishabh Pandya QA Lead — Sia Gandhi Client Sponsor — Timothy Wong, Spotify
Year
2025

What was the problem?

Independent artists face a "Cold Start Problem". To get booked, they need a professional Electronic Press Kit (EPK), but manual creation is expensive and requires high-level design skills. While they have streaming traction on Spotify, they lack the tools to turn that data into professional branding for industry gatekeepers.


The Roadblocks

The Trust Deficit

Industry gatekeepers demand verified, tamper-proof platform data rather than self-reported statistics.

API Deprecation

Spotify removed key audio analysis fields, making automated "sonic mood" extraction technically impossible via traditional API methods.

Generative Reputational Risk

AI hallucinations (fake awards/stats) destroy artist credibility in professional networking.

Discovery: Requirements Engineering

I applied MoSCoW prioritization to align artist branding needs with a strict 10-week technical cycle. This ensured our $0 budget focused on a functional core pipeline.

Stakeholder Requirements Matrix

I sourced requirements from Spotify Executives, DistroKid Managers, and Festival Bookers to define the essential metrics for industry vetting.

The Ava/Liam Framework

Engineered dual biography formats: Staccato Bio for quick mobile scanning and Legacy Bio for deep professional reading.

Quality Integrity Controls

Hardcoded the AI temperature to 0.1 (near-deterministic) to eliminate creative hallucinations in favour of strict factual accuracy.


Insights: Functional Prototyping

I moved the project from abstract code to a reactive Streamlit interface, allowing stakeholders to see a live visual prototype of their EPK.

The Editable Momentum Matrix

To bypass API limitations, I designed an interactive matrix allowing artists to manually input their tempo and sonic mood — turning a technical roadblock into a user-empowered feature.

Indie-Go editor preview

The side-by-side editor controls and live EPK preview.

The 5-Stage Autonomous Pipeline

Mapped a seamless 90-second workflow: Spotify Metadata Harvest → Bing HTML Research → AI Synthesis → Interactive Edit → PDF Export.

Indie-Go landing page

The professional entry point for users.


Impact and Performance

This solution transitioned branding from a multi-day manual hurdle to a 90-second automated service. By anchoring content to verified Spotify data, we established a single source of truth for independent artist vetting.

<90s
Total time from raw Spotify URL to print-ready PDF EPK
80%
Reduction in AI hallucinations via deterministic prompt engineering
100%
UAT pass rate delivered on $0 technology stack budget

I transformed a $0-budget prototype into a production-ready artist branding engine. By anchoring every feature to verified Spotify data and deterministic prompt logic, I eliminated the cold-start barrier for independent artists and delivered a fully audited, UAT-approved platform with zero hallucination risk.


Connect with me

Interested in working together or want to know more about this project? Reach out.

jeremysaaj4@gmail.com Jeremy Saaj JeremySaaj
MindMate AI

MindMate AI: From Static Academic Text to Adaptive AI Learning Journeys

MindMate AI opening
My Role
App owner/Developer Product Strategy, AI Workflow Design, UX/UI Oversight
Techniques
  • User Journey Mapping
  • Functional Requirement Specification
  • AI Interaction Design
  • Analytics Design
  • Gamification Strategy
Deliverables
  • Functional MVP: AI-Powered Adaptive Learning Platform.
  • AI Interaction Logic: 3-Level Flashcard Generation System (ELI5, School, Advanced).
  • Strategic Analytics Dashboard: Teacher "Gap Maps" and Student Progress Tracking.
  • Strategic Presentation: Project Demo Video.
Team
Product Lead AI Engineers Frontend Developers UI/UX Designer
Year
2026

What was the problem?

Millions of students fail or drop out annually because static textbooks and dense academic materials cannot adapt to their unique cognitive processing speeds. Traditional university materials are rigid and indifferent to the individual student's learning pace, leading to information overload and significant barriers to academic success.


The Roadblocks

Information Overload — Dense PDFs and academic documents are too complex for many students to process in their original form.
Lack of Real-Time Feedback — Teachers cannot identify specific "learning plateaus" in real-time, often discovering student struggles only after exam failures.
Static Curriculum — One-size-fits-all materials do not account for varying levels of prerequisite knowledge or different cognitive styles.
Student Disengagement — Abstract digital text lacks interactive engagement, often leading to a sense of isolation in digital learning environments.

Discovery: Requirements Engineering

I mapped stakeholder needs to bridge the gap between complex academic theory and AI-driven practical application. This visual roadmap ensured the platform served both the student's need for simplicity and the teacher's need for data.

Student Journey Frame — Mapped the transition from original professor-uploaded documents to interactive, modular AI deconstructions.
Teacher Analytics Frame — Designed the architecture for "Gap Maps" to visualize understanding deficits across a student's learning path.
Gamification & Wellness Frame — Integrated the "Trobee Companion" — a 3D visual aid that provides emotional support and visual continuity during intense study sessions.

Insights: AI Prototyping

I built prototype logic to visualize how raw academic datasets could be transformed into adaptive flashcards, bringing abstract requirements to life for the development team.

Adaptive Content Dashboard — Prototyped the 3-level explanation mode (ELI5, School, and Advanced) to validate content digestibility across different student demographics.
Recommendation Engine — Engineered the logic where quiz results directly trigger "Next Study Target" suggestions, ensuring concept mastery before a student can progress.
Teacher Gap Map View — Structured the backend analytics to provide educators with actionable insights into student learning plateaus and overall course performance.

Pitch and Impact

The analysis pitch proved that AI can effectively "translate" academic complexity into personalized success. By breaking down dense topics into 10 distinct modules with multi-tier difficulty, I provided a blueprint for personalized education that scales across various university subjects. This presentation established a single source of truth for student progress and wellness.

Watch the Full Strategic Presentation (10 min) — June 6, 2026

Key Metrics

3
Distinct complexity levels (ELI5, School, Advanced) for every study module
10
Unique topics AI deconstructs from a single dense academic document
100%
Targeted retention via mandatory mastery quizzes before lesson progression
0
Lag time between document upload and AI-generated adaptive flashcards

I transformed rigid, overwhelming curriculum into a development-ready adaptive platform. By bridging AI capabilities with student wellness, I anchored the MindMate solution in both academic performance and user engagement. Data-backed logic now guides the platform's ability to turn static materials into personalized learning journeys.


Connect with me

Interested in working together or want to know more about this project? Reach out.

jeremysaaj4@gmail.com Jeremy Saaj JeremySaaj
AFL

Consolidating fragmented match-day journeys into a unified AI-driven fan concierge

AFL Demon Guide opening
My Role
Lead Business Analyst (Project Originator) AI Solution Architecture, Requirements Engineering, UX Persona Mapping
Techniques
  • 7-Playbook Conversational Architecture Design
  • Targeted Fan Persona & Story Mapping
  • Hybrid Prompt Engineering & Data Grounding
  • KPI Development & Success Matrix Tracking
  • Iterative Prototype QA & Failure Testing
Deliverables
  • 7-Playbook Conversational Architecture: Centralized routing logic design.
  • Persona-Driven UX Strategy: Four core fan segments and nine user stories.
  • Consultancy-Style Strategic Report: Professional document covering AI governance and implementation.
  • Functional AI Prototype & 7-Minute Pitch: Recorded demonstration of match-day workflows.
Team
Jeremy Saaj (Lead BA / Originator) Priyanka Joshi Quang Dao Minh Phuong Dang
Year
2026

What was the problem?

Melbourne FC fans were trapped in a "fragmentation trap," forced to jump between the club website, Ticketmaster, and Google Maps just to plan a single match day. This disjointed journey created conversion latency — every platform switch increased the risk of the fan abandoning their ticket purchase. The club lacked a unified digital touchpoint, leading to increased pre-game anxiety for families and missed revenue opportunities.


The Roadblocks

Conversion Latency — Time costs of switching platforms directly reduced ticket completion rates.
Information Fragmentation — Venue logistics like gates and accessibility were buried across four separate web sources.
CX Anxiety — New fans and families felt overwhelmed by the scale of stadiums like the MCG without a guided assistant.
Technical Fragility — Significant challenges in grounding LLM logic to prevent "unhelpful generic responses" during data store failures.

Discovery: Requirements Engineering

I initiated the project ideation after identifying that match-day planning was a customer experience problem, not just a technical one. We mapped stakeholder needs into specific personas to ensure the AI's tone and logic matched real-world fan behavior.

Persona 1 & 2 — The First-Timer & The Die-Hard — Mapping needs for plain-English guidance vs. personalised AFL jargon.
Persona 3 & 4 — The Family Planner & Corporate Host — Requirements for pram-friendly logistics and premium-tier concierge responses.
User Story Mapping — Nine distinct stories (US-01 to US-09) were used to define "Happy Paths" for ticketing and parking.

Insights: AI Prototyping

I helped architect a 7-playbook hierarchy on Google Vertex AI to ensure the bot could handle multi-intent conversations without losing context.

Centralized Routing — A "Routing Playbook" acts as a traffic controller, directing users to specialist task domains like ticketing or parking.
Hybrid Prompting Strategy — We separated deterministic rules (for price accuracy) from generative flexibility (for natural tone) to eliminate hallucination risks.
Playbook Skeleton Map — Visualises the connection between the First Greeting Routine, the Router, and the five specialist task playbooks.
AFL Demon Guide playbook mapping

Pitch and Impact

The final pitch demonstrated a "Happy Path" journey where a fan could authenticate, book a ticket, and reserve parking in a single 5-minute conversation. By unifying these silos into one interface, we proved that AI could act as a "Match-Day Concierge," retaining session momentum and reducing operational drag for the club.


Key Metrics

≥85%
Containment rate targeted for resolving inquiries without human intervention
90%
Task completion rate verified through iterative testing of booking flows
≤5 min
Resolution time vs. manual multi-platform navigation

I transformed a fragmented fan journey into a development-ready AI architecture. By bridging the gap between fan psychology and technical playbook logic, I anchored the "Demon Guide" in measurable business value and enhanced customer experience.


Connect with me

Interested in working together or want to know more about this project? Reach out.

jeremysaaj4@gmail.com Jeremy Saaj JeremySaaj
AgriFuture Solutions

AgriFuture: Data-Driven Yield Optimization

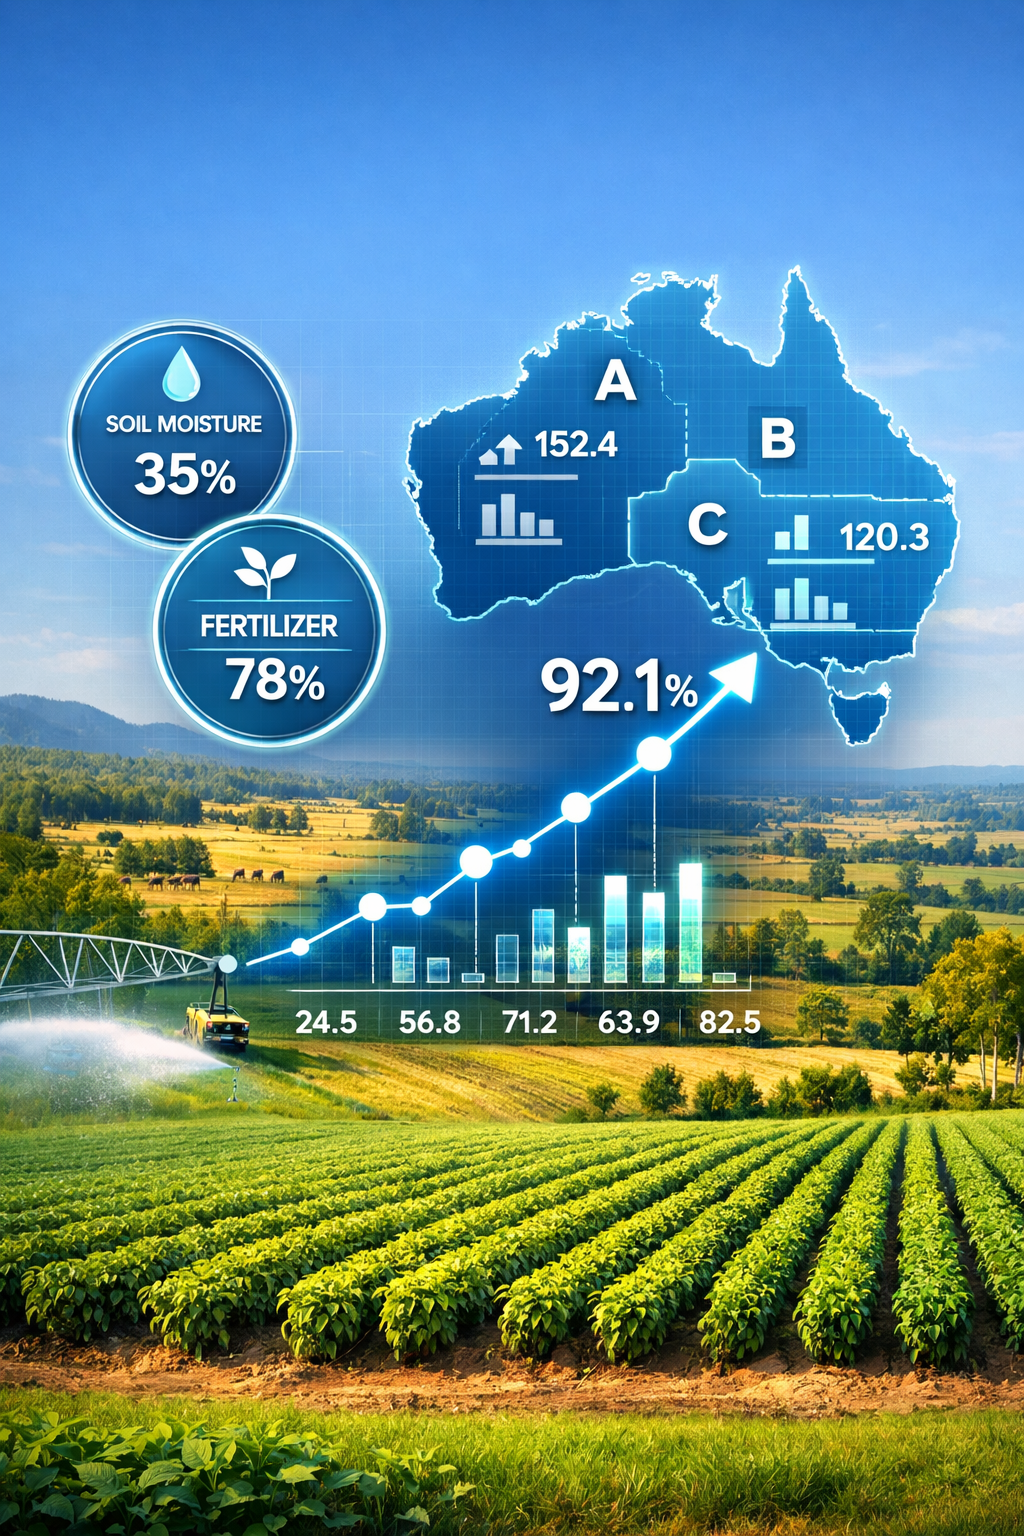
AgriFuture opening
My Role
Lead Business Analyst Statistical Modeling & Regional Benchmarking
Techniques
  • Descriptive Statistical Analysis
  • Data Binarization & Transformation
  • Iterative Regression Modeling
  • Outlier Treatment via Residual Analysis
  • Regional Benchmarking & Gap Analysis
  • Prescriptive Modeling for Resource Allocation
Deliverables
  • M3 Refined Model: 92.1% yield forecasting accuracy.
  • Benchmarking Report: Comparative analysis of Regions A, B, and C.
  • Resource Plan: High-ROI fertilizer and irrigation strategy.
Team
Senior Consultants Regional Producers Data Analysts
Year
2025

What was the problem?

AgriFuture needed to optimize 2026 investment across three Australian regions. Climate variability and soil degradation made it difficult to allocate budgets or predict yield outcomes effectively using traditional rainfall-only methods.


The Roadblocks

Inaccuracy — Initial models explained only 25.3% of yield variation.
Data Noise — Extreme weather outliers distorted historical projections.
Yield Gap — Region C underperformed by 5.3 t/ha compared to top-performing Region B.

Discovery: Analysis & Benchmarking

Baseline — Processed 4,899 farm observations across 8 key environmental factors.
Regional Standard — Identified Region B as the performance leader (75.03 t/ha median) to serve as a model for underperforming areas.

Insights: Iterative Modeling

Model Refinement — Scaled from a baseline rainfall model (M1) to a multi-factor predictor (M2).
Outlier Cleaning — Removed 26 anomalies (0.5% of data), reducing standard error by 30% in the final M3 model.
Top Drivers — Confirmed Fertilizer (+0.080) and Irrigation (+0.078) as the highest-ROI investment priorities.

Impact

Provided a validated 2026 roadmap prioritizing irrigation and fertilizer optimization in Region C. The M3 model achieved 92.1% accuracy, grounded in global standards from the FAO and CSIRO.


Key Metrics

92.1%
Final yield forecasting accuracy (R²)
30%
Error reduction through outlier treatment
5.3 t/ha
Regional performance gap identified
4,899
Farm records analyzed for the 2026 strategy

I transformed fragmented climate data into a high-precision operational tool, providing AgriFuture with the predictive certainty required to secure their 2026 investment strategy.


Connect with me

Interested in working together or want to know more about this project? Reach out.

jeremysaaj4@gmail.com Jeremy Saaj JeremySaaj
VicRoads

Victorian Road Accident Intelligence: From Fragmented Data to Policy Reform

Victorian Road Safety opening
My Role
Data Analyst Data Wrangling, Exploratory Data Analysis (EDA), and Strategic Policy Development
Techniques
  • Data Wrangling & Median Imputation
  • Geospatial & LGA Hotspot Mapping
  • Demographic Interaction Profiling
  • Strategic Policy Modeling
Deliverables
  • Integrated Unified Dataset: 300,000+ records merged from four disconnected agency silos.
  • Reproducible R Notebook: Complete script utilizing Tidyverse for end-to-end data processing.
  • Strategic Safety Report: Evidence-based policy recommendations for the government transport safety agency.
  • Visual Intelligence Suite: Interactive-style statistical charts identifying high-risk hotspots and lethality.
Team
Lead Analyst: Jeremy Saaj Policy Advisors Infrastructure Engineers Highway Patrol
Year
2025

What was the problem?

As a Data Analyst for a government transport safety agency, I was tasked with identifying rising road accident patterns that were previously obscured by fragmented data. The agency lacked a "source of truth," with critical information siloed across four separate files — Accident, Node, Person, and Atmospheric conditions. Furthermore, over 26,000 records were missing speed zone data, threatening to bias any high-level policy decisions.


The Roadblocks

Fragmented Agency Data — Critical insights were split across four CSV files, preventing a holistic view of crash factors.
Data Integrity Risks — A 5.9% data loss was imminent due to inconsistent "999" (unknown) speed zone entries.
Hidden Lethality Factors — High accident volumes at urban intersections distracted from the fact that straight rural roads were twice as deadly.

Discovery: Data Wrangling & Imputation

I engineered a robust data preparation plan in R to transform raw agency files into a clean analytical repository.

Standardization — Implemented a universal mapping for varied null strings (e.g., "NA", "999", "Unknown") to ensure uniform processing in R.
Median Imputation — Preserved 100% of the dataset by imputing the median speed (60 km/h) for missing values, ensuring the agency's findings remained statistically robust.
Feature Engineering — Derived "Hour of Day" and "Month" features to isolate the specific temporal windows where accidents peak.

Insights: Visual Intelligence (EDA)

I built a suite of ggplot2 visualizations to identify the primary drivers of road trauma in Victoria.

Frequency Hotspots — Identified 60 km/h urban arterial roads as the primary frequency outliers, seeing more incidents than high-speed motorways.
Geospatial Mapping — Ranked Melbourne (25,392 incidents) and Casey (22,862) as the highest risk zones, with a unique pedestrian risk profile in the CBD.
Lethality Modeling — A Cleveland dot plot revealed that straight road segments carry a fatality rate of 0.027 — double that of standard intersections.
The Friday Peak — Isolated 3 PM – 5 PM Fridays as the "perfect storm" for accidents due to overlapping school and work commutes.

Pitch and Impact

The analysis transitioned the agency from reactive responses to a four-pillar evidence-based strategy. This data-backed logic provided the justification for Dynamic Speed Zones in urban peaks and Physical Separation infrastructure in high-lethality rural zones.


Key Metrics

100%
Dataset integrity preserved through statistical median imputation
2x
Fatality risk on straight road segments vs. intersections
39,041
Accidents localized to the high-risk Friday afternoon peak window
40%
Involvement rate for high-risk young drivers (16–25) identified in filtered data

I transformed fragmented crash data into a policy-ready safety roadmap. By bridging the gap between raw data analysis and government strategy, I anchored the agency's safety investments in empirical evidence.